Villarreal vs Manchester United, Europa League Final 2020-21
May 2021
Underdogs Villarreal took on favourites Manchester United in The Europa League 2020-21 final on 26th May, 2021 in Gdansk, Poland.
Villarreal were eyeing European cup glory along with a spot in next year's competition, while Manchester United, having ended the Premier League season in 2nd place, had their eyes on what big clubs care most about - a trophy.
Let's pickup the action as it unfolded.

Keep scrolling to begin the walkthrough.
Or explore the data yourself.
Reading the Graphic
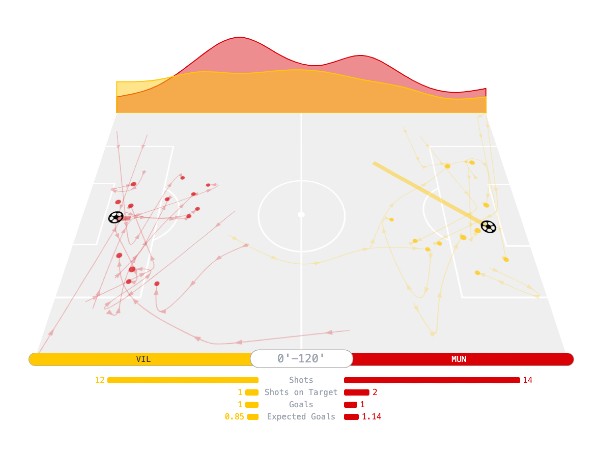
The graphic captures a passage of play, here the first 10 minutes of the match.
The area chart above the field is indicative of the distribution touches along the length of the field by each team.
The field shows all shots made by either team. Hover/tap on a shot for more info about a shot including expected goal (xG) value.
In the first 20 minutes, United retain most of the possession in the Villarreal half, but the threat on goal from either team is minimal.
United dominate possession even further but Villarreal are able to break on the counter and get some shots at the other end.
In the 28th minute, poor set piece defending at the far post lets Gerard Moreno tap in a cross from Parejo to put Villarreal in the lead.
Half Time: VIL 1-0 MUN.
A fairly even passage of play between the two teams ensues after the break.
United get chances at the goals however. And at 54', Cavani pounces on a ricocheted ball to get United on level terms.
54': VIL 1-1 MUN.
United push forward with bulk of the possession but aren't able to get that winning goal. Both teams are poor in finishing - this period sees 9 shots but none on target!
Full Time: VIL 1-1 MUN. This is going into extra time.
Villarreal come out the stronger team in extra time - they press United in their own half. United aren't able to play out from the back nor counter effectively.
End of Extra Time: VIL 1-1 MUN. The match goes into penalties.
End of Penalty Shootout VIL win 11-10 on penalties!
Explore Yourself
Use the controls to analyse any period in the match.
Data Source: Opta, Understat
Note 1: Injury time events have been wrapped into the last minute of that half/period of extra time.
Note 2: The touch distribution area chart has been constructed from dividing the length of the field into 9 bins and smoothing the resulting histogram with a cubic basis spline.