
Manchester City vs Chelsea, Champions League Final 2020-21
May 2021
Manchester City took on Chelsea in all English Champions League final game on 29th May, 2021 in Porto, Portugal.
This was a first CL finals for Manchester City, who were keen to add a first European trophy to their cabinet alongside all the domestic ones, the concluded Premier League included. Chelsea have been a thorn in their side off late however and with an impressive showing in the second half of the PL season under Tuchel, they would fancy their chances at becoming European champions a second time.
Let's pickup the action as it unfolded.
Keep scrolling to begin the walkthrough.
Or explore the data yourself.
Reading the Graphic
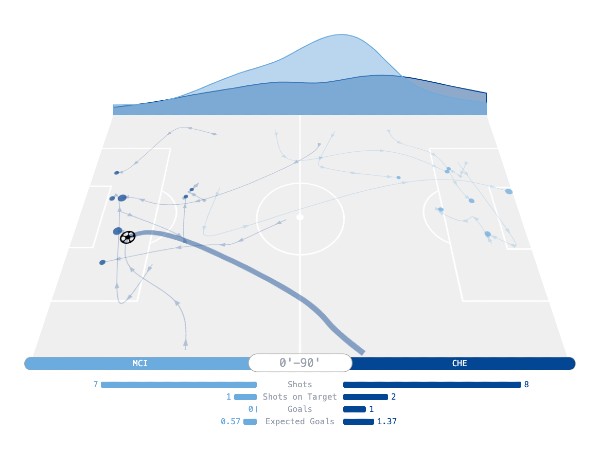
The graphic captures a passage of play, here the first 10 minutes of the match.
The area chart above the field is indicative of the distribution touches along the length of the field by each team.
The field shows all shots made by either team. Hover/tap on a shot for more info about a shot including expected goal (xG) value.
In the first half hour, City see more of the ball but both teams have shots at the goal.
Big chances for Werner(14', 0.39 xG) and Sterling(7', 0.22 xG), but they aren't able to convert.
The tables turn in terms of possession, with Chelsea edging out City on the ball.
At 41', Havertz gets on the end of a through ball from Mount and keeps a cool head to put Chelsea in the lead.
Half Time: MCI 0-1 CHE.
City keep most of the possession in search of an equaliser but Chelsea stay tight in defence, not giving too much by way of space or chances.
City also lose Kevin de Bruyne to a swollen eye injury, and with it potential creativity and venom in midfield.
A similar story plays out in the last 20 minutes, City continue to push with most of the possession but Chelsea are solid and of course, get some chances on the counter themselves.
Turns out the one goal is good enough for Chelsea who see out the game and are crowned champions of Europe.
Full Time: MCI 0-1 CHE.
Explore Yourself
Use the controls to analyse any period in the match.
Data Source: Opta, Understat
Note 1: Injury time events have been wrapped into the last minute of that half/period of extra time.
Note 2: The touch distribution area chart has been constructed from dividing the length of the field into 9 bins and smoothing the resulting histogram with a cubic basis spline.