Tottenham vs Man United, Premier League 2018-19
Jan 2019
Update: This piece was a winner of the Pudding Cup 2019.
Tottenham took on a resurgent Manchester United at Wembley on Jan 13th, 2019. For Tottenham, a win was important to keep their title hopes alive. For United, it was the first test against a tougher oppositiion under Solskjaer and post-Mourinho.
Let's pickup the action as it unfolded.

Keep scrolling to begin the walkthrough.
Or explore the data yourself.
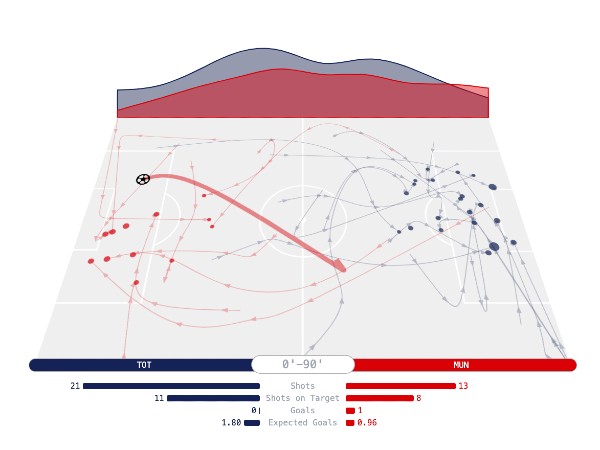
Reading the Graphic
The graphic captures a passage of play, here the first 10 minutes of the match.
The area chart above the field is indicative of the distribution touches along the length of the field by each team.
The field shows all shots made by either team. Hover/tap on a shot for more info about a shot including expected goal (xG) value.
Tottenham build play out from the back while United look to counter fast on the transition.
Harry Winks misses out an early chance to score in the 8th minute (0.33 xG).
A similar pattern of play continues. United concede 0 Shots On Target, and look dangerous on the counter.
In the 43rd minute, a loose pass from Trippier is collected by Pogba, played long to Rashford who scores.
Half Time: TOT 0-1 MUN.
An even battle between the teams, with United playing more steadily out of their own half.
Both teams get shots on goal.
In the last half hour, Tottenham dominate possession, that too in the United half.
They record 10 shots of which 7 are on target, only to be denied time and again by David De Gea.
Full Time: TOT 0-1 MUN.
Explore Yourself
Use the controls to analyse any period in the match.
Data Source: Opta, Understat
Note 1: Injury time events have been wrapped into the last minute of that half/period of extra time.
Note 2: The touch distribution area chart has been constructed from dividing the length of the field into 9 bins and smoothing the resulting histogram with a cubic basis spline.